Chaos Mesh is a cloud-native chaos engineering platform that orchestrates chaos experiments in a Kubernetes environment. It allows you to test the resilience of your system by simulating issues such as network failures, file system failures and Pod failures. After each chaos experiment, you can view the test results by looking at the logs.
However, this approach is neither straightforward nor efficient. Therefore, I decided to develop a daily reporting system that could automatically analyse the logs and generate reports. This way, it is easy to check the logs and locate problems.
In this article, I will describe how Chaos Engineering can help us improve system resilience and why we need a daily reporting system to complement Chaos Mesh. I will also give you some personal insights into how to build a daily reporting system, including the problems I encountered in the process and how I solved them.
What is Chaos Mesh and how can it help us
Chaos Mesh is a chaos engineering platform for orchestrating Kubernetes faults. With Chaos Mesh, we can easily simulate various extreme situations in our business to test whether our systems are intact.
At my company, Digital China, we have combined Chaos Mesh with our DevOps platform to provide a one-click CI/CD process. Every time a developer commits code, the CI/CD process is triggered. During this process, the system builds the code and performs unit tests and SonarQube quality checks. The images are then packaged and published to Kubernetes, and at the end of the day, our daily system pulls the latest image of each project and chaos-engineers it.
This simulation does not require any changes to the application code; Chaos Mesh takes care of the heavy lifting. It injects various physical node failures into the system, such as network latency, network loss and network duplication. It also injects Kubernetes failures, such as Pod failures or container failures. These failures can expose vulnerabilities in our application code or system architecture. When vulnerabilities surface, we can fix them before they cause real damage to production.
However, finding these vulnerabilities is not easy: the logs must be read and analysed carefully. For application developers and Kubernetes experts, this can be a daunting task. Developers may not be able to use Kubernetes well; and Kubernetes experts may not understand the logic of the application either.
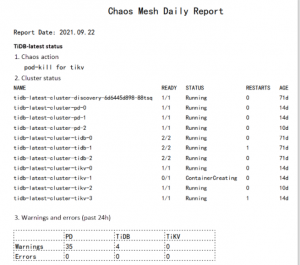
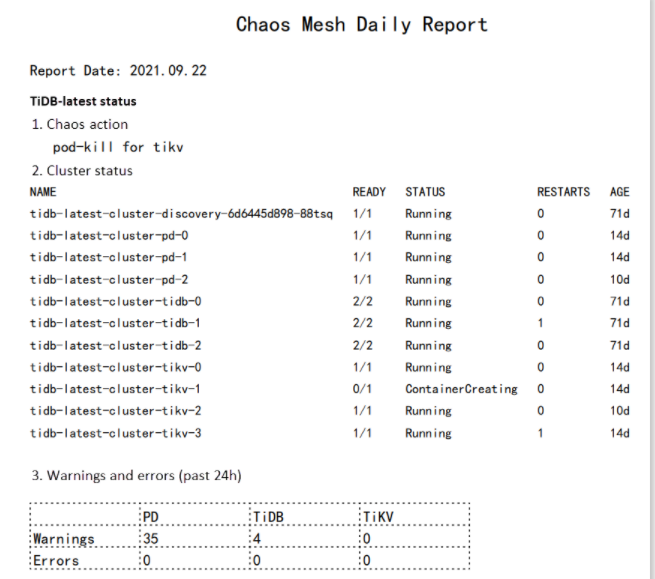
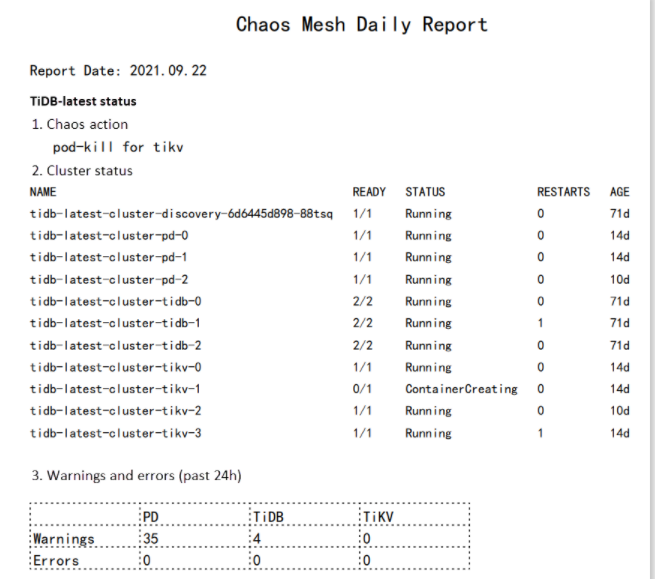
This is where the Chaos Mesh daily reporting system comes in handy. After daily Chaos experiments, the daily reporting system collects logs, charts them, and provides a web UI for analysing possible vulnerabilities in the system.
In the next sections, I will explain how to run Chaos Mesh on Kubernetes, how to generate daily reports, and build a web application for the daily reports. You will also see an example of how the system can help us in production.
Running Chaos Mesh in Kubernetes
Chaos Mesh is designed for Kubernetes, which is one of the key reasons it allows users to inject faults into the filesystem, Pod or network for a specific application.
In early documentation, Chaos Mesh provides two ways to quickly deploy a virtual Kubernetes cluster on your machine: kind and minikube. in general, deploying a Kubernetes cluster and installing Chaos Mesh requires only a single command. However, starting a Kubernetes cluster locally affects the type of failures associated with the network.
If you deploy a Kubernetes cluster using kind using the provided script, all Kubernetes nodes are virtual machines (VMs). This can make it more difficult when you pull offline images. To solve this problem, you can deploy a Kubernetes cluster on multiple physical machines, each acting as a worker node. To speed up the image pulling process, you can use the docker load command to load the required images in advance. Apart from the two issues above, you can install kubectl and Helm according to the documentation.
Before installing Chaos Mesh, you need to create a CRD resource.
After that, use Helm to install Chaos Mesh:.
To run a Chaos experiment, you must define the experiment in a YAML file and start it using kubectl apply. In the following example, I have created a chaos experiment to simulate a Pod failure using PodChaos.
Let’s apply the experiment.
Generating a daily report
For demonstration purposes, in this article I have run all the chaos experiments on TiDB, an open source distributed SQL database. To generate a daily report, you need to collect logs, filter errors and warnings, draw a graph, and then output a PDF.
Collecting logs
Typically, chaos experiments run on a TiDB cluster will return many errors. To collect these error logs, run the following kubectl logs command.
In the namespace tidb-test, all logs generated by a particular Pod in the last 24 hours are saved to the tidb.log file.
Filtering errors and warnings
In this step you must filter error messages and warning messages from the logs. There are two options.
Use a text processing tool, e.g. awk. This requires proficiency in Linux/Unix commands.
Write a script. If you are not familiar with Linux/Unix commands, this is the better option.
The extracted error and warning messages will be further analysed in the next step.
Drawing
For plotting, I recommend gnuplot, a Linux command line plotting tool. In the example below, I imported the stress test results and created a line graph to show how the queries per second (QPS) are affected when a particular Pod is unavailable. Since chaos experiments are periodic, the number of QPS follows a pattern: it drops suddenly and then quickly returns to normal.
Summary
The Chaos Mesh daily reporting system has been live in our company for four months. Fortunately, the system has helped us to find errors in several projects in extreme situations. For example, on one occasion we injected a network duplication and network loss fault into the application and set the duplication and packet loss rates to high levels. As a result, the application encountered an unexpected situation during message parsing and request distribution. A fatal error was returned and the application exited abnormally. With the help of the daily reports, we quickly obtained graphs and logs of the specific error. We used this information to easily pinpoint the cause of the exception and fix the system vulnerability.
Chaos Mesh enables you to simulate the faults that most cloud-native applications are likely to encounter. In this article, I created a PodChaos experiment and observed that the QPS in a TiDB cluster was affected when a Pod was unavailable. After analysing the logs, I was able to improve the robustness and high availability of the system. I also built a web application to generate daily reports for troubleshooting and debugging. You can also customise the reports to suit your own requirements.


