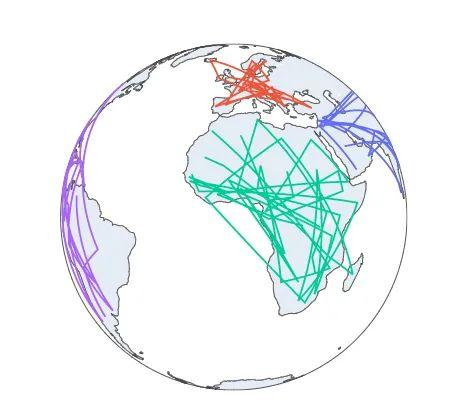
In a previous article Python visualization wizard-Plotly animation demonstration shows the basic application of visualization wizard-Plotly animation, this article introduces how to use Plotly in Python to create a map and mark the corresponding lines on the map.
Adding lines to a globe
According to the area of the globe display on the corresponding location of the graph to add lines, the perfect linear globe detailed code as follows:

The results are displayed as:

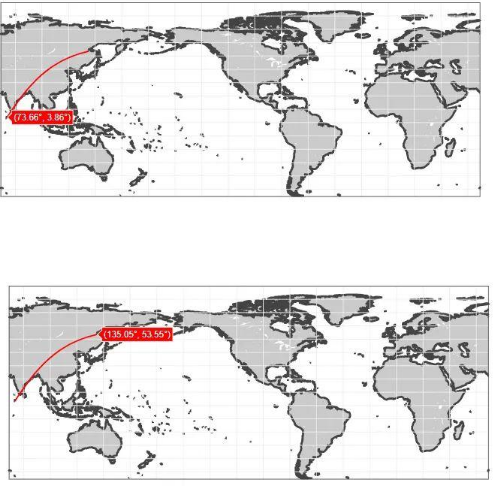
Add lines on the map
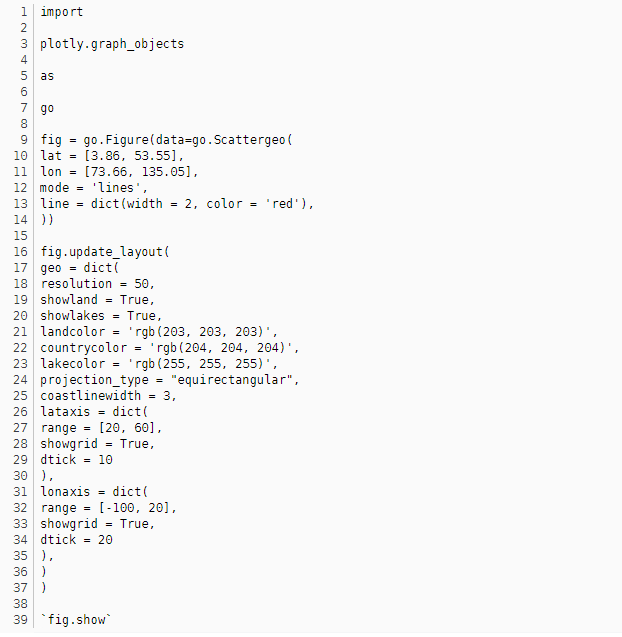
Add latitude and longitude after drawing the corresponding map, and then draw the corresponding lines according to latitude and longitude, and finally, if your time is not very tight, and want to quickly python improve, the most important thing is not afraid to suffer, that really good, many people progress quickly, you need to not be afraid to suffer Oh! Everyone can go to add on to see ~ Detailed code is as follows:
The results are displayed as follows:
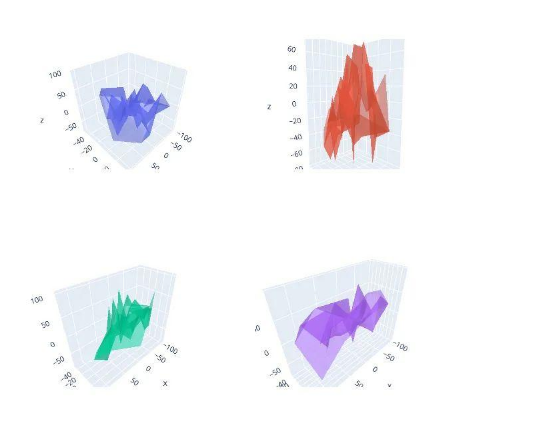
The last benefit – 3D image appreciation
Finally, a 3D image appreciation is added to create the image detail code as follows.
The results are displayed as follows:
Summary
I hope that today’s article and the actual battle to help you, in the future the road to god more and more smooth!
